Question 01
The project began with a question about how songs gain chart visibility. It examines gradual climbs, sudden rises and re-entries across eight cases. The available dataset supports retrospective comparisons; it does not establish whether chart success could have been predicted in advance.
For this study, “breakout” means the representative song’s first entry into the US Billboard Hot 100 Top 40. This provides a consistent definition for comparing the cases.
What was built 02
The dataset contains eight artist-song cases, using a defined weekly study window around each breakout date. A source log records the available observations, relevant definitions and data-quality notes.
Components
- A cleaned weekly dataset of chart positions and derived movement measures.
- Event research: 38 dated release, social, performance and media events.
- A source record with URLs, retrieval dates, definitions and data-quality notes.
- An English-language presentation summarising the research question, comparisons and limitations.
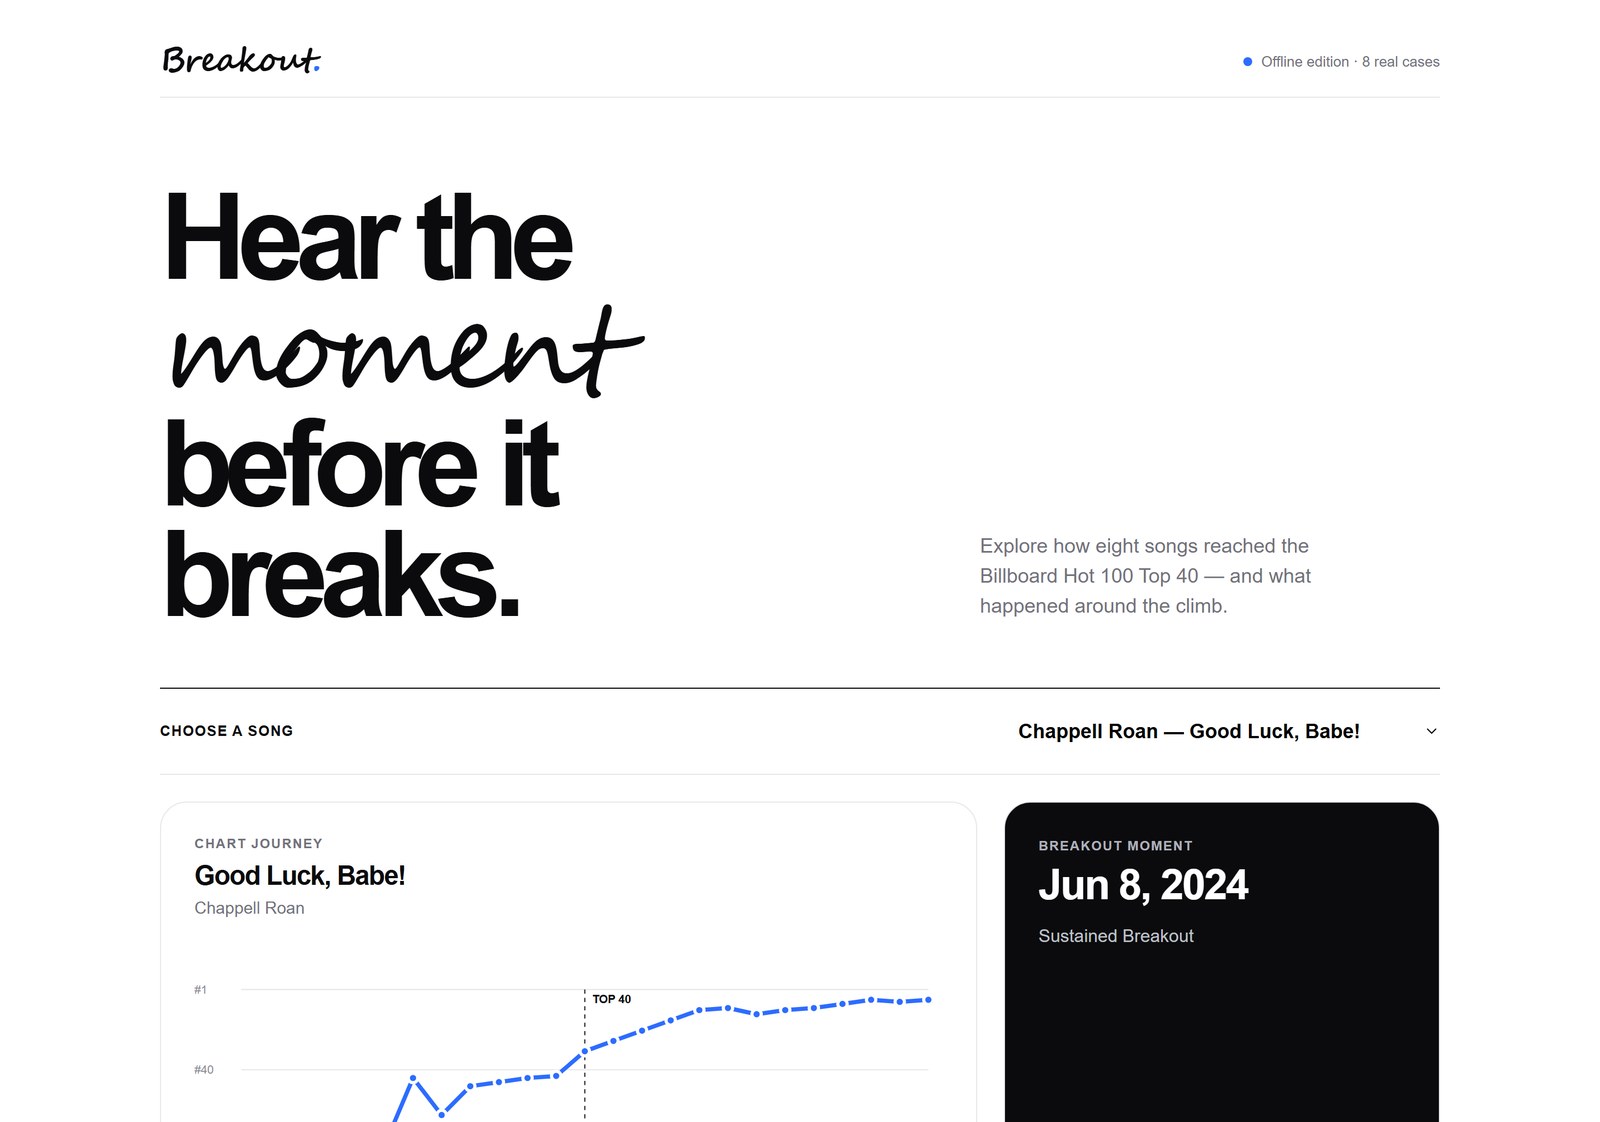
- An offline interface for selecting a song and exploring its chart journey, breakout date, events and source coverage.
Findings 03
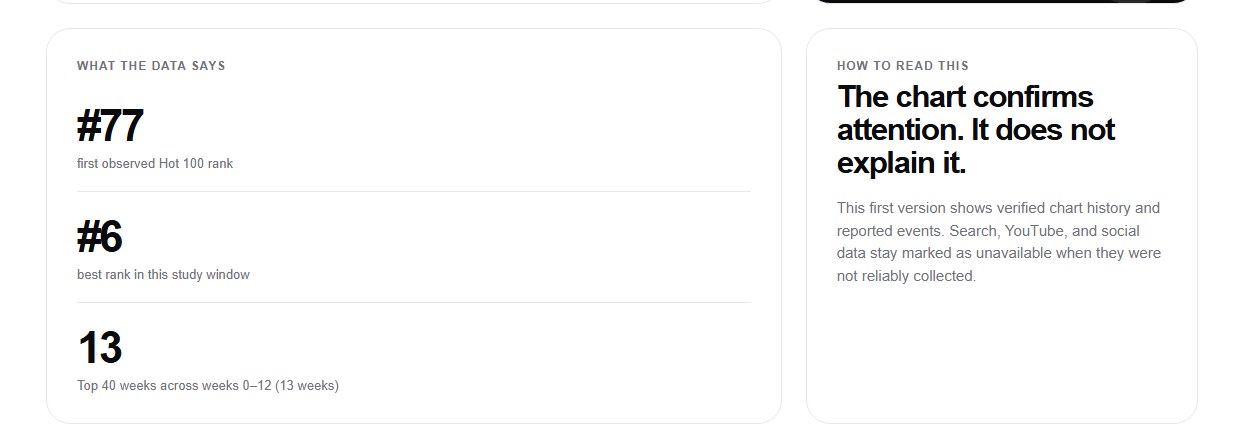
Five of the eight songs stayed inside the Hot 100 Top 40 for all 13 post-breakout weeks in the study window. That is a statement about durability within a short window, not about long-term success.
Three cases were already inside the Top 40 at the start of their observed windows. This limits what those cases can show about the period before breakout and illustrates the importance of the observation window.
Chappell Roan’s Good Luck, Babe! provides a gradual-climb example in this dataset, moving from a first observed rank of 77 to a study-window best of 6. This is a retrospective description of the observed chart trajectory.
What the case comparison can show
The gradual climb in Good Luck, Babe! can be compared with cases that were already in the Top 40 when observation began. The first provides a visible transition within the study window; the second group has limited pre-breakout evidence. These are differences in observed coverage as well as in chart trajectory, so they should not automatically be interpreted as distinct routes to success.
A useful next comparison would align cases around their defined breakout dates, show the available pre-breakout weeks and distinguish missing observations from weeks outside the chart. Historical attention indicators would then need separate validation before being treated as leading signals. This is proposed further work.
Where the evidence stops 04
The evidence is strongest for chart history, because chart history is what was reliably retrievable. Historical Google Trends and YouTube weekly observations could not be obtained at a reproducible scope, so those fields remain NA rather than filled with estimates.
NA indicates that a measurement was not reliably available, rather than a value of zero. Keeping these fields explicit helps distinguish missing evidence from observed results.
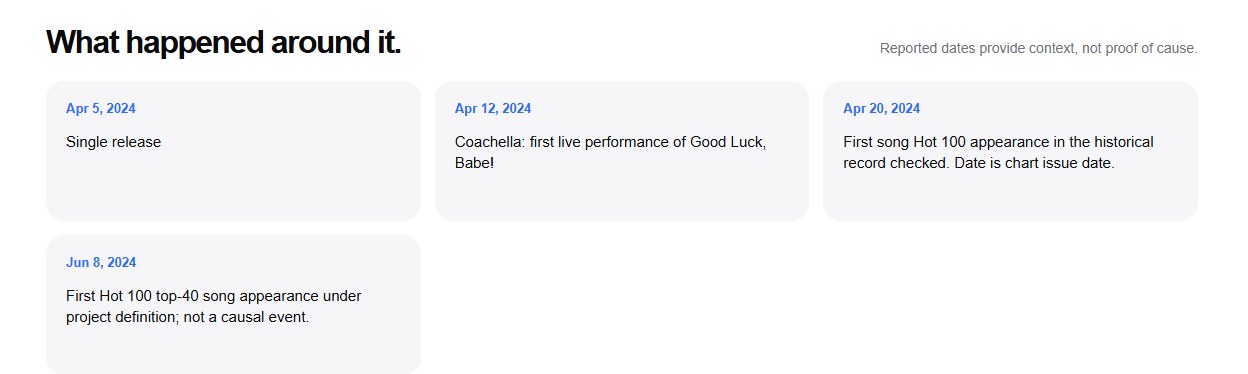
Dated events provide context for chart movement. An event and a chart rise occurring in the same week do not establish that the event caused the rise.
The prototype 05
The prototype is a local, offline interface — no server, no live connection, no hidden refresh. A reviewer selects a song and moves through its chart journey, its breakout date, the dated events around it and the sources behind each observation.
What it is
- An exploratory research prototype for comparing chart trajectories and organising dated contextual material.
- An interface intended for readers interested in music, marketing and audience research.
What it is not
- A finished prediction system. No model is claimed and no accuracy figure is offered.
- A substitute for the missing weekly search, video and social series — the next product step would be to add those and test whether they lead the chart.